Creating professional reports

Excel sheets to excellent designs: creating non-boring reports
Annual reports are essential company documents. Especially as it is a legal document required by law in the UK to divulge your company’s assets and finances. Your Financial and End of Year Report is submitted to Companies House or various organisations. Once the information is gathered a report can be created.
It can be a few pages of A4, or you can turn it into a dynamic marketing tool for your business.
Annual report design and report design are something that you can hand over to a freelance designer.
Over the years, I have lost count of the reports I have designed for my clients - some are displayed in my portfolio. They list from:
Annual reports
Research Result reports
Infographic presentations
Question and Answer reports
Competitor analysis
Company Brochure which includes statistics

Businesses have included publishers, banks, schools, SAAs companies, asset management companies, and risk management companies.
A few clients I have worked with:
Airmic
Global reinsurance
Insurance Times
Strategic Risk
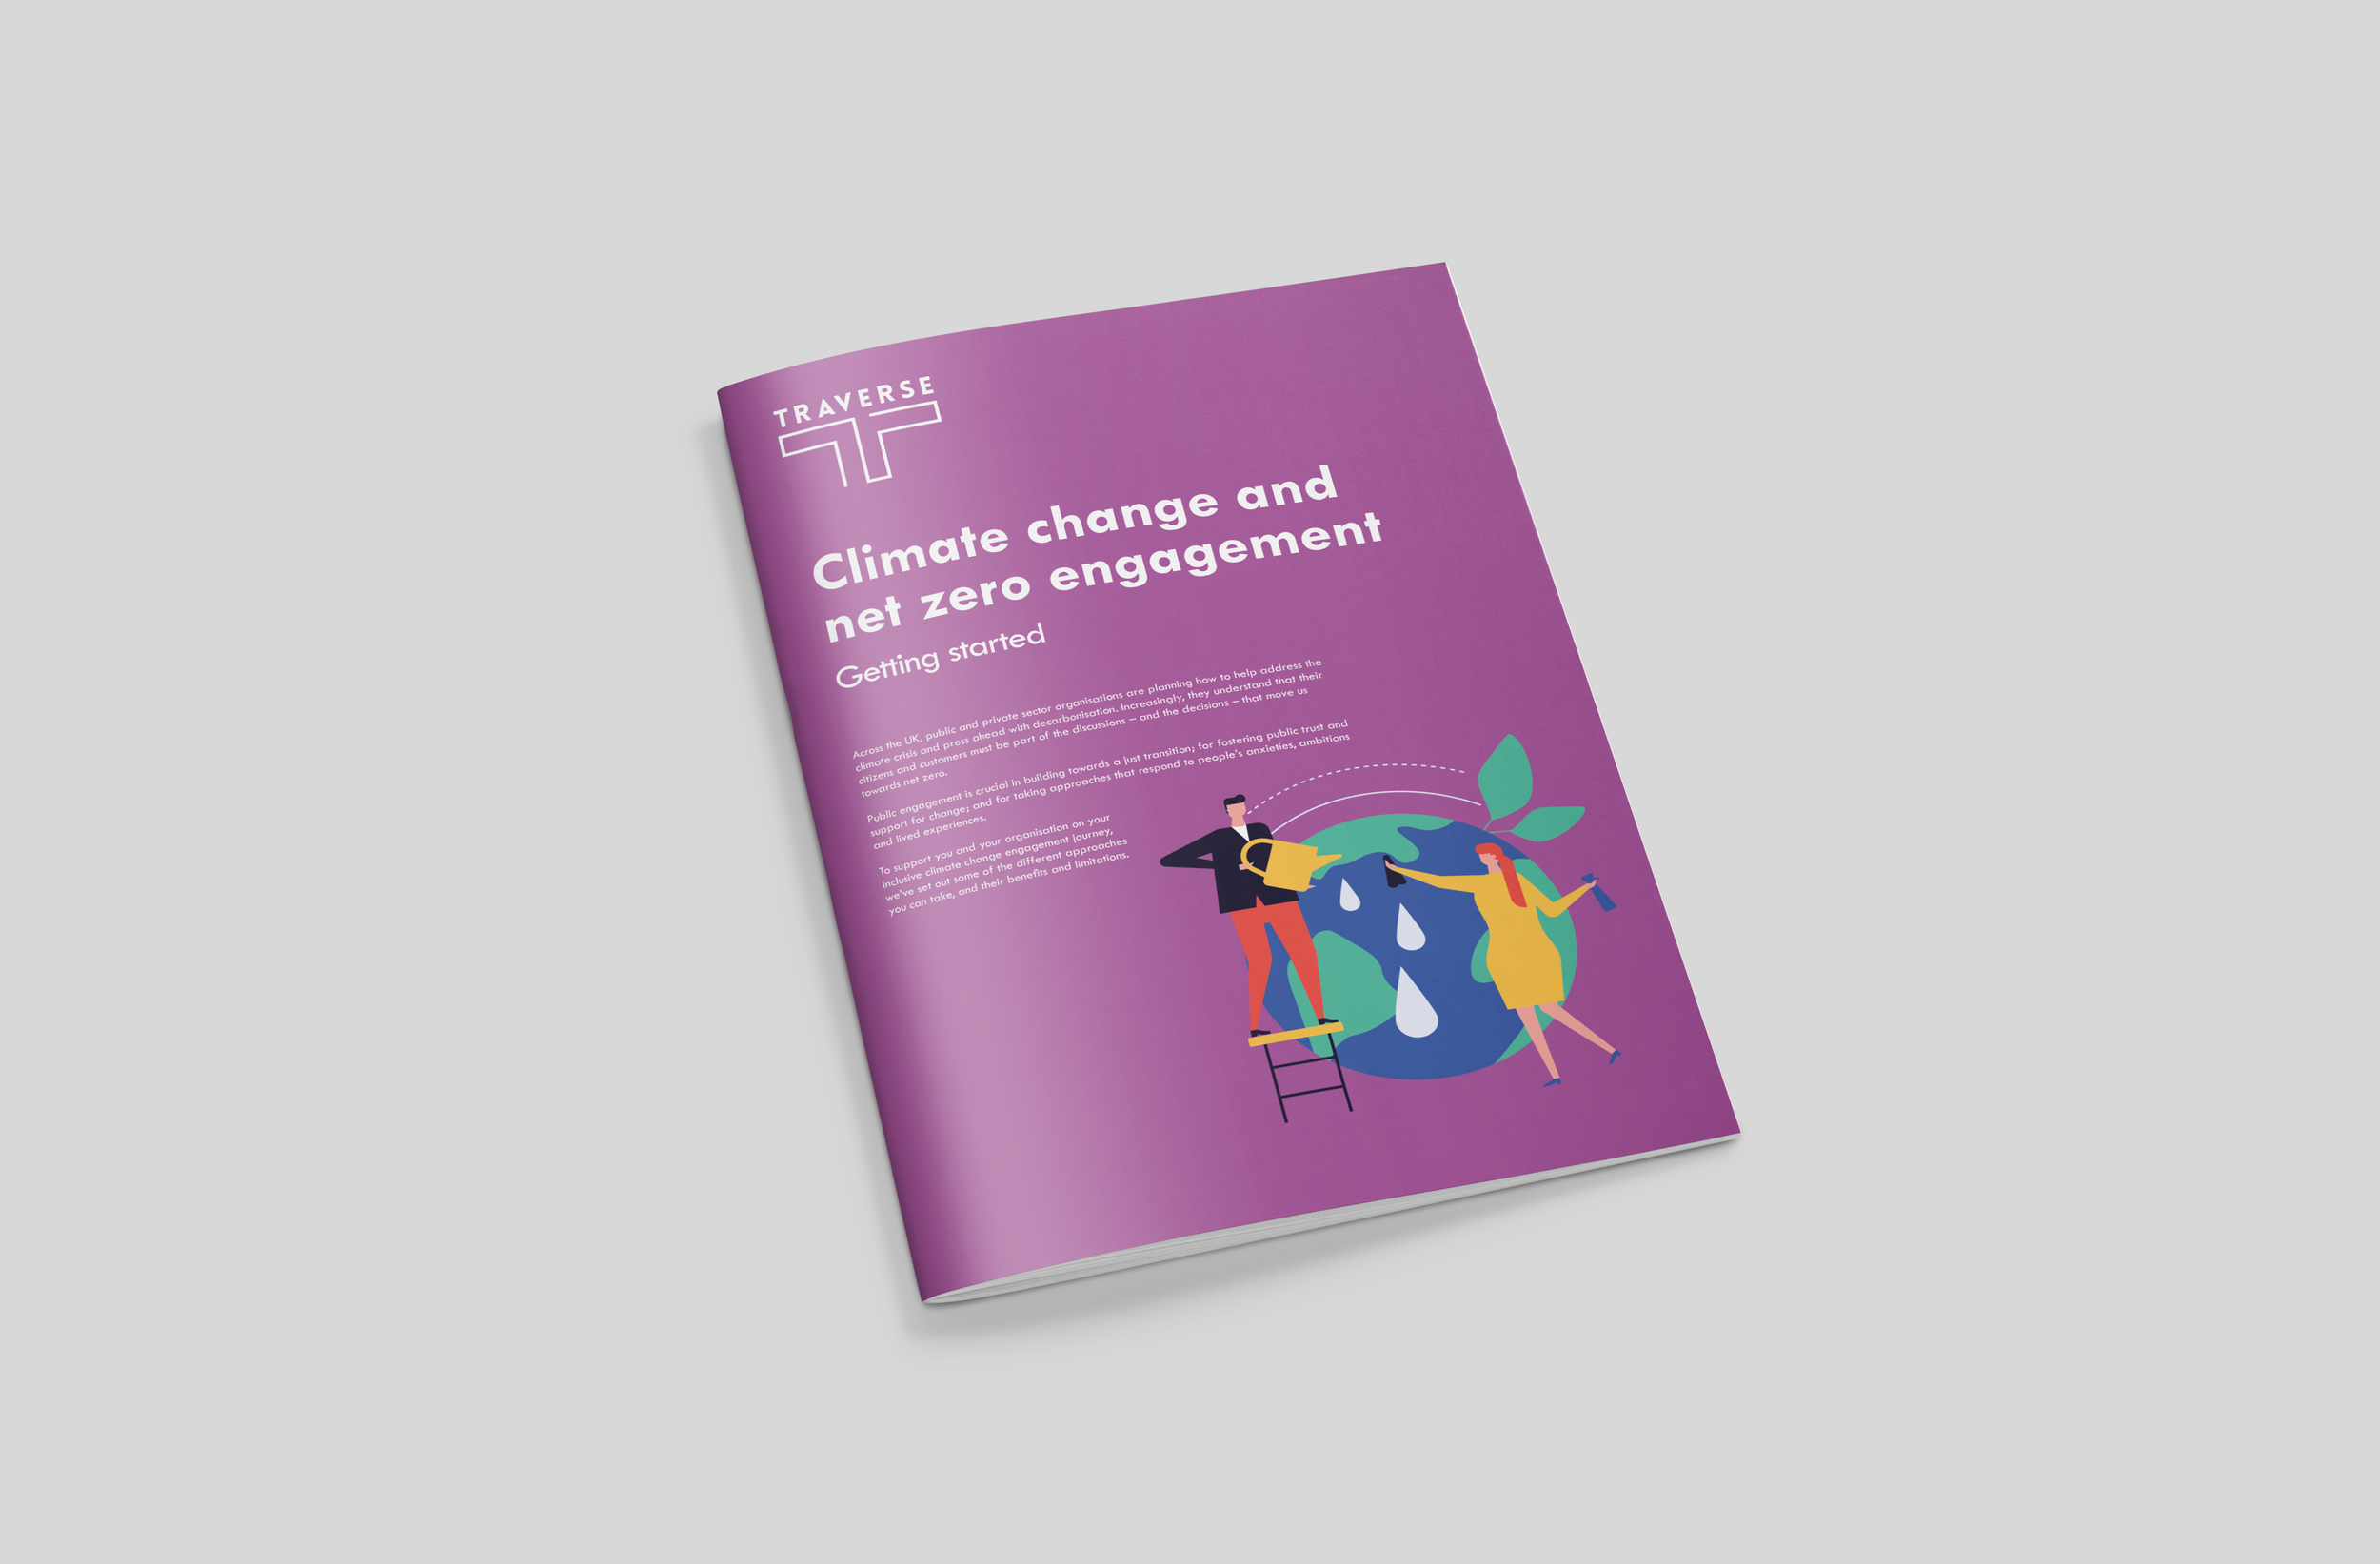
Traverse
Brooks Macdonald
Collecting the data
I work alongside annual report writers – who are specialists in an area of the report. For example, a pharmaceutical report will need to be written by someone who has an understanding of medical terminology. A report written for an asset management company is written by a business copywriter. I know it may sound obvious but they will get caught out if it’s not written in the correct term.
Another option by receiving the data by a client sending over the files and providing me with the data.
Data can be dry and dull, and there are lots of numbers and digits, so some say. I don’t say that because I know that an Excel sheet can be an important document to your business, and it is important information collected for your business.

Using a report as a marketing tool
Another tool that the report can use is a marked-in tool for your business. It’s great to have all the documents and all the reports and numbers in one place but this this report can be used as a marketing tool to show the world what your business is about.
You can place it on your website as a downloadable PDF. It could be broken up into a blog on your website increasing the chance of it being picked up by other potential clients.
You can use social media graphics throughout the year. Our information about your business in this report can be refurbished in so many ways.
Repurposed means to use ideas again in documents, blog posts, social media posts, podcast episodes, downloadable PDFs, fact sheets for trade shows or email newsletters the list goes on. Any one document can be repurposed especially if it’s your financial assets for the year and has your company values in it it can be reused for the year to tell the world about your company and that could be your potential clients you never know who’s looking.
Clients often come to me with an Excel or Word files, asking me to create a report and infographics based on the findings.

Images and Infographics
Images are as important as words. If you have the budget you can organise a professional photoshoot of your company. This could be the people within your organisation, your products or a brand shoot of you.
This step-by-step, easy process will let you know how I approach the design.
How to work with me on your report
Discovery call: We start with a conversation about your project, goals, and expectations. This also helps us determine if we’re the right fit for each other.
Project brief and strategy: We define the project scope, requirements, and key objectives. I’ll create a master plan, including timelines, milestones, and delivery expectations from both sides.
No brand guidelines? No problem: If you don’t have existing brand guidelines, I can create them for you as a separate project to ensure visual consistency.
Content and assets collection: If you have text, images, data, or brand elements to include, you’ll provide them at this stage. If needed, I can assist with content refinement or sourcing visuals.
Design phase: I develop designs that align with your brand’s identity. Whether your budget allows for multiple options or just one, I ensure consistency with your brand guidelines.
First proof and revisions: I design all printed reports using Adobe InDesign. If digital, we agree on the final format. You’ll receive an initial draft, and we’ll go through agreed-upon revisions to refine it.
Quality check and final approval: Before finalising, I conduct a thorough review to ensure accuracy, consistency, and overall quality. You’ll have a final opportunity to approve the design before delivery.
Final delivery: I prepare and provide the files in your required format, for print or digital use. If needed, I can liaise with printers or advise on the best digital format for distribution.
How long does this process last? The easy answer is - it depends. You may have a 100-page document or you may have a eight page document either way that document needs to be designed and we can work out the timings of how long it will take from them it also depends on the assets listed above if you have those of your rich such as for photography. The images do the infographics need to be created from scratch?

Concluding
In the past, I’ve worked in-house and at agencies creating annual reports and research reports for clients. These can be specific topics or they can be a full report about your business.
An annual report designer does not have to sit within a large agency organisation. You can cut out the middle people (with overheads) and work with someone like me, a freelance designer.
Book a call to work on your company report.